Opis
Komponent niewidoczny z palety „Maps”. Pobiera prognozę z serwera https://weather.imetroll.com/v1/forecast. Przyjmuje parametry od programisty, dokleja key= (ApiKey), wysyła GET, zwraca JSON w OnDataReady / DataJSON. Mapa z WeatherInfo=True rysuje ikonę + temperaturę na obszarze. Wykresy Chart.js nie są rdzeniem TWeather — używaj innych komponentów / własnego UI.
Moduł: MapCommon.Weather (+ Weather.Types / Area / Client / Colors / Overlay / AreaResolve) · Klasa bazowa: TComponent · Platformy: VCL + FMX
Demo na żywo
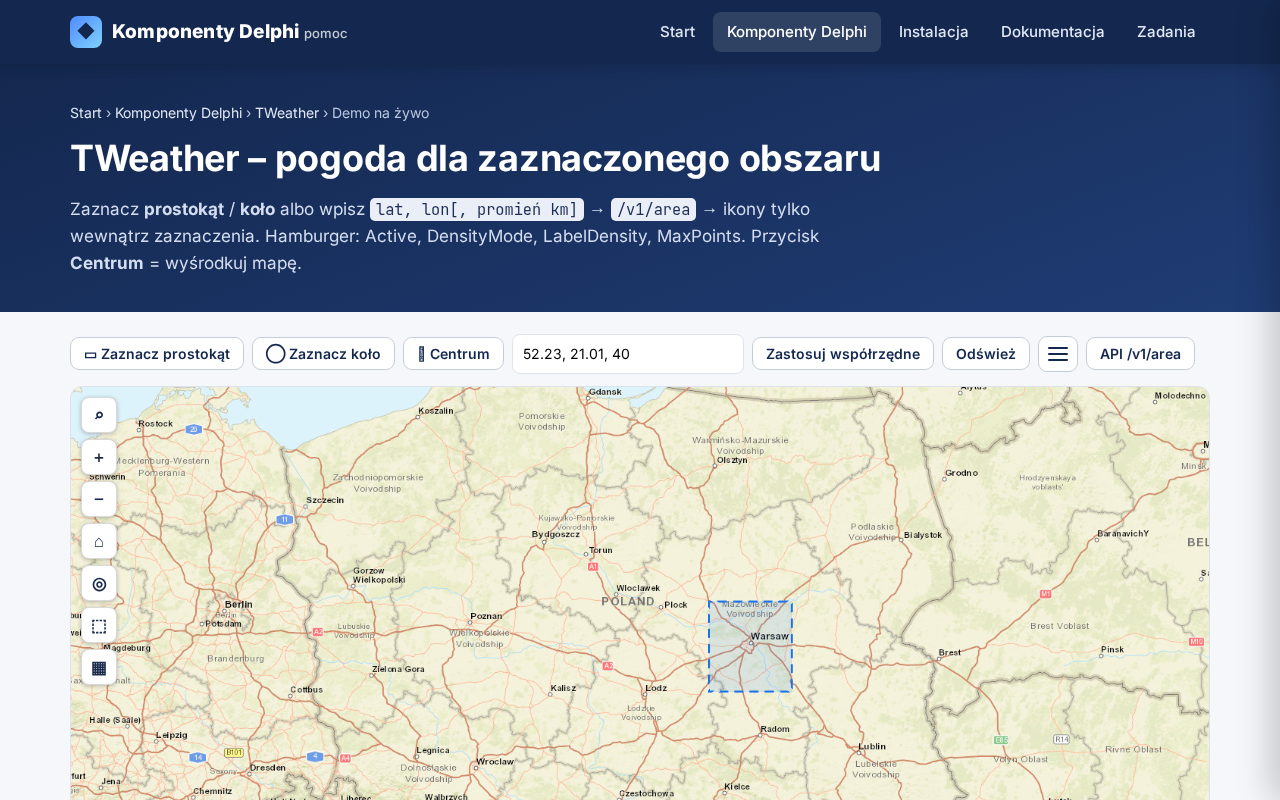
Dwa dema middleware: ikony+temp na obszarach z JSON; surowy JSON do aplikacji. Nakładka gradient + modal wykresów pozostaje jako przykład opcjonalny.
Zaznacz prostokąt / koło lub wpisz lat, lon[, km] → GET /v1/area. DensityMode=admin: ikona = WinningBit (WBS_*), temp = średnia — nie mean(WMO).
▶ Active + zaznaczenie / współrzędne + głosy ikonyScene+HourStrip+DayItems+Chart; nie MapInfoWindow.
▶ TWeatherPopup — pełne okno prognozyTWeather + HourStrip/DayItems/Chart wypełniają gotowe okno prognozy.
▶ Klik obszaru → okno prognozyFetch JSON → setWeather mode=labels (icon+°C, pulse, ScaleFactor/MinScreenWidth). Map.WeatherInfo.
▶ Ikony + temp na obszarachKlik → GET + key= → surowy JSON current/hourly/daily (temp, wilgotność, wiatr, UV, feels-like, is_day).
▶ Middleware JSON (aplikacja)Województwo → JSON do dalszego kodu (bez Chart.js jako rdzenia).
▶ Klik obszaru → JSONStarszy przykład gradient/piksele + modal Dziś/7 dni (wykresy ≠ rdzeń TWeather).
▶ Opcjonalnie: gradient + modalWeather ↔ Scene: ApplyJSON / SceneJSON (dzień/noc, chmury, deszcz, gwiazdy) — bez GET w Scene.
▶ TWeatherScene – animacja tłaFunkcje
- Middleware: programista → TWeather (
Request/RefreshAsync) → GET +key=→OnDataReady(JSON). - Auth:
RequireApiKey=True(domyślnie) blokuje pobranie bez klucza; serwer weather.imetroll.com wymaga?key=na/v1/*. - ForecastKind:
wfkCurrent/wfkHourly/wfkDaily7(mapuje Sections + ForecastDays). - JSON:
current(temp, wilgotność, wiatr speed+direction, UV, odczuwalna, nasłonecznienie:sunshine_duration[s] +shortwave_radiation[W/m²], weather_code, is_day, opady),hourly,daily(~7 dni; daily:shortwave_radiation_sumMJ/m²), poleicon. - Map.WeatherInfo: True = mapa renderuje pogodę z JSON; False = ignoruje nakładkę/etykiety.
- Display (ikony): ShowAreaLabels, DensityMode (admin/grid/auto), LabelDensity (thin 0/1/2), IconMotion (static/pulse/wave), LabelChrome (tło / same etykiety), Opacity, ScaleFactor, MinScreenWidth, UseCustomIcons + CustomIcons (PNG).
- Interval / AutoRefreshMinutes — cykliczny Refresh (samodzielna aplikacja pogodowa bez Chart.js).
- Active = auto query: zaznaczenie obszaru na mapie (prostokąt →
wakBBox, koło / wielokąt →wakPolygon) lubApplyCoords(Lat, Lon[, RadiusKm])(bez promienia = 1 punkt) → od razuRefreshAsync; stare zapytanie anulowane. - Serwer area-scoped:
GET weather.imetroll.com/v1/area(prostokąt / koło / punkt / area=) – siatka punktów w jednym zapytaniu, ten sam kontrakt co fly / boatsea. - CreateWidget / CreateWidgetAtCentroid / CreateWidgetsForAreas: ikona+wartość w środku obszaru; treść z OnWidgetContent; WidgetStyle (border/text/bg/opacity).
- Ikona obszaru: NIE średnia kodów WMO — stany binarne potęgi 2 (
WBS_CLEAR=1,WBS_SUN=2,WBS_CLOUDS=4,WBS_RAIN=8); suma głosów próbek w województwie (AreaBinaryVotes.SumBits);WinningBit→ ikona; temp = średnia; widget w centroida. - Display.DensityMode: admin (1 widget / jednostka + głosy ikony) | grid (MaxPoints/PointsPerAdmin) | auto (kraj=admin1, zoom-in=gęściej, punkt=1).
- Map.WeatherClickMode: drabinka zoom — kraj → województwo → punkt (gdy znikają granice); średnia obszaru + środek obszaru.
- Zdarzenia mapy: OnMapClick / Areas.OnAreaClick (lewy); prawy/long-press = edycja obszaru; programista sam woła TWeather.
- Opcjonalnie: gradient/piksele (
ShowAreaLabels=False); Charts demoted (ShowOn* = False). - Roadmap 2c (po middleware/ikonach, nie blokuje bieżącego API): (1) intensywność opadów + zachmurzenie jako gradient na kaflach/raster 2D; (2) na mapie 3D żywe chmury na wysokościach + warstwa deszczu razem z chmurami.
- TWeatherScene: animacja tła aplikacji —
Weather.Scene/Scene.Weather; Scene tylko ApplyJSON (bez GET).
ApiKey → wekUnauthorized (klient) lub HTTP 401 (serwer).Właściwości
| Właściwość | Opis |
|---|---|
| ApiKey / Key | Klucz API; doklejany jako &key= (ApiKeyParam domyślnie key). |
| RequireApiKey | True (domyślnie) = blokada Request/Refresh bez klucza. |
| ForecastKind | wfkCurrent / wfkHourly / wfkDaily7. |
| Area | lat/lon (wakPoints), bbox, kraj, województwo, polygon. |
| UseMapAreaSelection, AutoRequestOnAreaSelect, ShowAreaOnMap | Zaznaczenie mapy / współrzędne → Area; Active=True → RefreshAsync (domyślnie True). |
| Interval | Alias AutoRefreshMinutes — timer cykliczny (minuty). |
| BaseURL, Parameters, Sections, ForecastDays | Niskopoziomowe opcje Open-Meteo (Sections uzupełnia ForecastKind). |
| Map | TTileMap*/T3DMap*; AutoLink + reverse Map.Weather. |
| Map.WeatherInfo | Na mapie: True = rysuj pogodę z JSON (ikony/nakładka). |
| Display.ShowAreaLabels | Ikona + temperatura na punktach i obszarach. |
| Display.LabelDensity | 0 rzadko / 1 normalnie / 2 gęsto — rzadziej etykiety przy oddaleniu. |
| Display.DensityMode | wdnmAdmin / wdnmGrid / wdnmAuto — admin=1/jednostka+centroid (ikona = WinningBit głosów WBS_*, temp = średnia); grid=MaxPoints/PointsPerAdmin; auto wg zoomu. |
| PointsPerAdmin | Limit punktów/widgetów na jednostkę admin w trybie grid (0 = tylko MaxPoints). |
| WidgetStyle | Styl CreateWidget: BackgroundColor, TextColor, BorderColor/Width/Radius, Opacity, FontSize/Weight, Padding, Shadow. |
| Map.WeatherClickMode | wcmAuto / AreaAverage / Point — klik: średnia+centroid obszaru vs punkt+Nominatim; Auto wg widocznego admin zoom. |
| Map.WeatherPointModeMinZoom | Zoom, od którego Auto = punkt (domyślnie 8; dopasuj do MaxZoom stylu granic). |
| Display.IconMotion | wimStatic / wimPulse / wimWave. |
| Display.LabelChrome | wlcIconLabelBackground / wlcLabelsOnly. |
| Display.Opacity, ScaleFactor, MinScreenWidth | Krycie; skala ikon; poniżej MinScreenWidth bez powiększania, powyżej — ScaleFactor. |
| Display.UseCustomIcons, CustomIcons | Własne PNG (WMO code=url) zamiast emoji. |
| Display (gradient) | ShowAreaLabels=False → wdmGradient/wdmPixels + legenda (opcjonalnie). |
| Charts | Opcjonalne (demoted); domyślnie wyłączone. |
| Areas, AutoLinkComponents | Kontury województw; auto-link formy. |
| Scene | TWeatherScene — chrome animacji; reverse Scene.Weather; Scene nie woła serwera. |
| Header | TWeatherHeader — nagłówek okna (ikona + obszar); klik ikony → HourStrip. |
| WidgetStyle.Theme / Blur / Border* | Skórka iOS/Android/custom dla pigułek na mapie (glass + obramowanie). |
Zdarzenia
| Zdarzenie | Opis |
|---|---|
| OnDataReady(JSON) | Po udanym Request/RefreshAsync — middleware JSON (current/hourly/daily + icon). |
| OnError | wekUnauthorized, sieć, timeout, obszar… |
| OnProgress | Postęp partii przy wielu punktach. |
| OnResolveArea | Dostarczenie GeoJSON konturu. |
| OnChartsRequest | Opcjonalnie (Charts.ShowOn*); preferuj zdarzenia mapy + DataJSON. |
| OnAreaApplied | Area podmienione z mapy / współrzędnych (przed zapytaniem). |
| Map.OnMapClick / Areas.OnAreaClick | Interakcja myszy/dotyku — programista woła TWeather. |
Metody
| Metoda | Opis |
|---|---|
| Request / Refresh / RefreshAsync / Cancel | Budowa GET+key=; synchronicznie / async; anulowanie. |
| DataJSON | Ostatni JSON middleware (jak argument OnDataReady). |
| BeginAreaSelect(Shape) / CancelAreaSelect | Rysowanie prostokąta / koła / wielokąta na mapie (pan-lock). |
| ApplyMapArea(Area) / ApplyCoords(Lat, Lon, RadiusKm=0) / ApplyCoordsText / ApplyBounds | Obszar z mapy / współrzędnych; Active → RefreshAsync. |
| UpdateDisplay / ClearDisplay | Ponowne wypchnięcie / ukrycie ikon lub gradientu (gdy WeatherInfo). |
| CreateWidget / CreateWidgetAtCentroid | Jedna etykieta ikona+wartość na lat/lon lub centroida obszaru (OnWidgetContent). |
| CreateWidgetsForAreas / ClearWidgets | Wiele widgetów na centroidach FeatureCollection; ClearWidgets = ClearDisplay. |
| EffectiveDensityMode | DensityMode po resolve względem aktualnego WeatherClickTarget. |
| DetectLinkedComponents | Ponowne Map / Areas. |
| ChartsJSON* | Opcjonalne serie pod własne wykresy. |
Przykłady
TWeather middleware + ikony + ScaleFactor
// Middleware: ApiKey wymagany; ForecastKind; ikony+temp na obszarach
// Map.WeatherInfo = True → mapa rysuje JSON; Display.ScaleFactor / MinScreenWidth
procedure TForm1.FormCreate(Sender: TObject);
begin
  Weather1.ApiKey := GetEnvironmentVariable('WEATHER_API_KEY'); // doklejane jako &key=
  Weather1.RequireApiKey := True;
  Weather1.ForecastKind := wfkDaily7;          // current / hourly / daily7
  Weather1.Area.Kind := wakRegion;
  Weather1.Area.RegionName := 'mazowieckie';
  Weather1.Interval := 30;                     // alias AutoRefreshMinutes (aplikacja cykliczna)
  TileMap1.Weather := Weather1;
  TileMap1.WeatherInfo := True;                // mapa ma rysować pogodę z JSON
  Weather1.Display.ShowAreaLabels := True;     // ikona + temperatura na obszarze
  Weather1.Display.IconMotion := wimPulse;     // wimStatic / wimWave
  Weather1.Display.LabelChrome := wlcIconLabelBackground; // lub wlcLabelsOnly
  Weather1.Display.Opacity := 0.95;
  Weather1.Display.ScaleFactor := 1.4;         // skalowanie ikon na większym ekranie
  Weather1.Display.MinScreenWidth := 768;      // poniżej = bez powiększania
  Weather1.OnDataReady := Weather1DataReady;
  Weather1.OnError := Weather1Error;
  Weather1.Request;                            // alias Refresh; lub RefreshAsync
end;
OnDataReady(JSON) / OnError
procedure TForm1.Weather1DataReady(Sender: TObject; const JSON: string);
begin
  MemoRaw.Text := JSON;   // current / hourly / daily + icon (jak odpowiedź serwera)
  // albo Weather1.DataJSON; ikony już na mapie gdy WeatherInfo + ShowAreaLabels
end;

procedure TForm1.Weather1Error(Sender: TObject; Kind: TWeatherErrorKind;
  const ErrorMessage: string);
begin
  Memo1.Lines.Add('TWeather: ' + ErrorMessage);  // wekUnauthorized bez ApiKey
end;
Co wysłać / co wraca (I/O serwera)
// Co wysłać DO TWeather → co wraca z serwera (middleware)
// 1) Programista ustawia: ApiKey/Key, ForecastKind, Area (lat/lon lub region), Parameters
// 2) TWeather buduje GET na https://weather.imetroll.com/v1/forecast?...&key=APIKEY
// 3) OnDataReady(JSON) / DataJSON — pola current/hourly/daily jak Open-Meteo
// Przykład URL (klucz zawsze na końcu):
// GET /v1/forecast?latitude=52.23&longitude=21.01
// ¤t=temperature_2m,...,uv_index,wind_speed_10m,wind_direction_10m,
// sunshine_duration,shortwave_radiation,is_day
// &hourly=...&daily=...&forecast_days=7&timezone=auto&key=***
// JSON (skrót): current.temperature_2m, .weather_code, .apparent_temperature (feels-like),
// .uv_index, .wind_speed_10m, .wind_direction_10m,
// .sunshine_duration (nasłonecznienie [s]), .shortwave_radiation (W/m²),
// .is_day; hourly.*; daily.* + shortwave_radiation_sum; + "icon"
Weather1.ForecastKind := wfkHourly;
Weather1.Area.Kind := wakPoints;
Weather1.Area.Points.Text := '52.23,21.01';
Weather1.RefreshAsync;Zdarzenia mapy/obszaru
// Zdarzenia mapy/obszaru (programista obsługuje — TWeather nie jest modułem wykresów)
// Lewy klik obszaru:  TMapAreas.OnAreaClick
// Lewy klik mapy:     Map.OnMapClick
// Prawy / long-press: edycja obszaru gdy Areas.EditPopupEnabled (contextmenu / touch)
// Dblclick:           zaznaczanie poligonu w trybie rysowania mapy
//
// W handlerze: ustaw Area na punkt/region → Request/RefreshAsync → OnDataReady(JSON)
procedure TForm1.Areas1AreaClick(Sender: TObject; const SetId: string;
  const Lat, Lon: Double; const CountryISO2, FeatureName, PropertiesJSON: string);
begin
  Weather1.Area.Kind := wakPoints;
  Weather1.Area.Points.Text := Format('%.5f,%.5f', [Lat, Lon]);
  Weather1.RefreshAsync;
end;
Prezentacja: motion, chrome, custom PNG, skala
// prezentacja bez nowego zapytania
Weather1.Display.IconMotion := wimWave;
Weather1.Display.LabelChrome := wlcLabelsOnly;
Weather1.Display.ScaleFactor := 1.6;
Weather1.Display.MinScreenWidth := 600;
TileMap1.WeatherInfo := True;
Weather1.UpdateDisplay;

// własne PNG zamiast emoji (WMO code = URL / data:image/png;base64,…)
Weather1.Display.UseCustomIcons := True;
Weather1.Display.CustomIcons.Text :=
  '0=https://cdn.example/sun.png' + sLineBreak +
  '3=https://cdn.example/cloud.png';
Weather1.UpdateDisplay;
Parsowanie JSON middleware
// Middleware: OnDataReady(JSON) — surowy + pola
procedure TForm1.Weather1DataReady(Sender: TObject; const JSON: string);
var
  Root: TJSONValue;
  Cur: TJSONObject;
begin
  MemoRaw.Text := JSON;
  Root := TJSONObject.ParseJSONValue(JSON);
  try
    Cur := (Root as TJSONObject).GetValue('current') as TJSONObject;
    if Cur <> nil then
      Caption := Format('%.0f °C  %s', [
        Cur.GetValue('temperature_2m').AsDouble,
        (Root as TJSONObject).GetValue('icon').Value]);
  finally
    Root.Free;
  end;
end;
Ikona obszaru: głosy binarne (WBS_* / WinningBit)
// Ikona obszaru = głosy binarne (potęgi 2), NIE średnia kodów WMO
// WBS_CLEAR=1, WBS_SUN=2, WBS_CLOUDS=4, WBS_RAIN=8
procedure TForm1.ShowAreaIcon;
var
  Votes: TWeatherBinaryVotes;
  Win: Integer;
  TempC: Double;
  Icon: string;
begin
  // Weather1.Display.DensityMode := wdnmAdmin;  // 1 widget / województwo
  // po Refresh / OnDataReady:
  Votes := Weather1.Data.AreaBinaryVotes;          // lub AreaBinaryVotes(UsePointMask)
  Win := Votes.WinningBit;                         // remis: rain > clouds > sun > clear
  TempC := Weather1.Data.AverageCurrent(wpTemperature2m);
  Icon := WeatherBinaryStateIcon(Win, True, TempC); // = WeatherIconEmoji(WMO 0/1/3/61, …)
  Memo1.Lines.Add(Format(
    'CLEAR=%d SUN=%d CLOUDS=%d RAIN=%d SumBits=%d WinningBit=%d → %s %.0f°C',
    [Votes.Clear, Votes.Sun, Votes.Clouds, Votes.Rain, Votes.SumBits, Win, Icon, TempC]));
  // CreateWidgetAtCentroid używa tego samego: ikona=WinningBit, temp=średnia
  Weather1.CreateWidgetAtCentroid('mazowieckie');
end;

// Mapowanie WMO → bit (WeatherCodeToBinaryState):
//   0 → CLEAR, 1 → SUN, 2..48 → CLOUDS, ≥51 → RAIN
// AverageCurrent(wpWeatherCode) zwraca WMO zwycięskiego bitu (0/1/3/61), nie mean(codes).
Opcjonalne Charts (nie rdzeń)
// OPCJONALNIE — wykresy to inne komponenty / własne UI (Charts demoted)
Weather1.Charts.Enabled := True;
Weather1.Charts.ShowOnAreaClick := True;
Weather1.OnChartsRequest := Weather1ChartsRequest;
Active: zaznaczenie obszaru lub współrzędne → automatyczne zapytanie
Weather1.Active = True na mapie: wybór obszaru (przycisk nawigacji Zaznacz obszar, BeginAreaSelect; mysz lub palec, pan/drag mapy zablokowany)
albo współrzędne (ApplyCoords / ApplyCoordsText / ApplyBounds)
od razu wysyła zapytanie (RefreshAsync) do weather.imetroll.com. Zapytanie trwające dla starego obszaru jest porzucane / anulowane.
Active = False → zmienia się tylko Area; zapytanie wywołujesz sam (Request).
| Źródło obszaru | TWeather.Area | Zapytanie (Active=True) |
|---|---|---|
| Prostokąt narysowany na mapie | wakBBox + South/West/North/East | siatka w prostokącie |
| Koło narysowane na mapie | wakPolygon (koło → GeoJSON) | siatka punktów przycięta do koła |
ApplyCoords(Lat, Lon, RadiusKm) | wakPolygon (koło → GeoJSON) | siatka w kole |
ApplyCoords(Lat, Lon) (bez promienia) | wakPoints – 1 punkt | jedna prognoza |
ApplyCoordsText(Edit1.Text) | "52.23, 21.01, 50" · "52,23; 21,01; 50" · "52.23 21.01 50km" · "lat=52.2 lon=21 r=30" (promień opcjonalny); False = nie rozpoznano (+ OnError) | |
ApplyBounds(S, W, N, E) | wakBBox | siatka w prostokącie |
| Właściwość / zdarzenie | Opis |
|---|---|
UseMapAreaSelection (True) | Zaznaczenie na mapie podmienia Area. |
AutoRequestOnAreaSelect (True) | Przy Active=True: nowy obszar → RefreshAsync. False = tylko Area. |
ShowAreaOnMap (True) | ApplyCoords / ApplyBounds rysują obszar na mapie (bez ponownego areaSelected). |
OnAreaApplied | Po podmianie Area (przed zapytaniem). |
Map.OnAreaSelected pozostaje Twoim zdarzeniem: TAircraft, TBoats i TWeather słuchają tej samej mapy równolegle
(TMapCore.AddAreaSelectedListener, multicast) – jedno zaznaczenie może zasilić wszystkie trzy.
Weather1.Active := True;
Weather1.BeginAreaSelect;                      // rysuj na mapie → zapytanie
Weather1.ApplyCoords(52.23, 21.01, 40);            // współrzędne + promień [km] → zapytanie
if not Weather1.ApplyCoordsText(Edit1.Text) then ShowMessage('lat, lon[, km]');
weather.imetroll.com/v1/area – pogoda dla obszaru (GET)
GET https://weather.imetroll.com/v1/area?…&key= – pogoda dla obszaru (siatka punktów w jednym zapytaniu do Open-Meteo). Brak obszaru → HTTP 400; nigdy cały świat.
| Tryb | GET | TWeather (Delphi) |
|---|---|---|
| rectangle | lamin lomin lamax lomax | ApplyBounds / prostokąt z mapy → wakBBox |
| radius | lat lon radius_km | ApplyCoords(Lat, Lon, Km) / koło z mapy → wakPolygon |
| point | lat lon | ApplyCoords(Lat, Lon) → wakPoints |
| named | area=mazowieckie | GET /v1/area/areas (pl, warsaw, mazowieckie, malopolskie, pomorskie, tatry…) |
| Parametr | Opis |
|---|---|
grid_km | Oczko siatki [km] (domyślnie auto) |
max_points | Maks. punktów (domyślnie 64, max 150; oczko rośnie) |
current hourly daily forecast_days past_days timezone … | Przekazywane do Open-Meteo (domyślnie current: temp, wilgotność, weather_code, zachmurzenie, opad, wiatr, is_day) |
| JSON | Opis |
|---|---|
bbox.mode | rectangle | radius | point (+ lamin…lomax, lat/lon/radius_km, area) |
grid_km, count, upstream_ms | Siatka / liczba punktów / czas Open-Meteo |
points[].lat, lon, grid_lat, grid_lon, elevation | Punkt siatki + komórka modelu |
points[].current / hourly / daily (+ *_units) | Jak /v1/forecast |
Delphi TWeather buduje siatkę po stronie klienta (GridResolutionKm, MaxPoints) i działa z każdym serwerem zgodnym z Open-Meteo;
/v1/area służy aplikacjom HTML/JS i innym klientom.
Ikona obszaru (głosy binarne)
Przy DensityMode=admin / CreateWidgetAtCentroid / AreaAverage ikona nie jest średnią arytmetyczną weather_code
(średnia 0 i 61 ≈ 30 — bez sensu). Zamiast tego:
- Każdy punkt próbki w poligonie (województwo) dostaje jeden bit stanu:
WBS_CLEAR=1,WBS_SUN=2,WBS_CLOUDS=4,WBS_RAIN=8(mapowanie WMO: 0→clear, 1→sun, 2…48→clouds, ≥51→rain). AreaBinaryVotessumuje bity (SumBits) i liczy głosy per stan (Clear/Sun/Clouds/Rain).WinningBit= stan z największą liczbą głosów (remis: rain > clouds > sun > clear) → emoji / WMO reprezentatywne (0/1/3/61).- Temperatura przy ikonie = zwykła średnia z próbek; pozycja = centroida poligonu (
WeatherLabelAnchor).
| Bit | Wartość | WMO → | Reprezentatywne WMO | Ikona |
|---|---|---|---|---|
WBS_CLEAR | 1 = 2⁰ | 0 | 0 | ☀️ |
WBS_SUN | 2 = 2¹ | 1 | 1 | 🌤️ |
WBS_CLOUDS | 4 = 2² | 2…48 | 3 | ☁️ |
WBS_RAIN | 8 = 2³ | ≥51 (deszcz/śnieg/burza) | 61 | 🌧️ |
API: TWeatherDataSet.AreaBinaryVotes, WeatherCodeToBinaryState, WeatherBinaryStateToWmoCode,
WeatherBinaryStateIcon, AverageCurrent(wpWeatherCode) = WMO zwycięskiego bitu.
Votes := Weather1.Data.AreaBinaryVotes;
Win := Votes.WinningBit;                              // np. WBS_RAIN = 8
TempC := Weather1.Data.AverageCurrent(wpTemperature2m);
Icon := WeatherBinaryStateIcon(Win, True, TempC);
// CreateWidgetAtCentroid / PlaceMultiAreaWidgets robi to samo automatycznie
Weather1.Display.DensityMode := wdnmAdmin;
Weather1.CreateWidgetsForAreas;                       // 1 ikona / województwo
▶ Demo: Active + DensityMode=admin (głosy)
Kody WMO (weather_code)
Pole weather_code → WeatherIconEmoji / WeatherWmoCodeDesc. Rodzina UI: TWeatherScene, TWeatherHourStrip, TWeatherDayItems, TWeatherChart (AutoLink do TWeather, ApplyJSON na OnDataReady). Ikony: wbudowane albo UseCustomIcons + CustomIcons (code=url).
| Kod | Ikona | PL | EN |
|---|---|---|---|
0 | ☀️ | Bezchmurnie | Clear sky |
1 | 🌤️ | Przeważnie bezchmurnie | Mainly clear |
2 | ⛅ | Częściowo pochmurno | Partly cloudy |
3 | ☁️ | Zachmurzenie całkowite | Overcast |
45 | 🌫️ | Mgła | Fog |
48 | 🌫️ | Mgła szronowa | Depositing rime fog |
51 | 🌦️ | Lekka mżawka | Light drizzle |
53 | 🌦️ | Umiarkowana mżawka | Moderate drizzle |
55 | 🌧️ | Gęsta mżawka | Dense drizzle |
56 | 🌧️ | Lekka marznąca mżawka | Light freezing drizzle |
57 | 🌧️ | Gęsta marznąca mżawka | Dense freezing drizzle |
61 | 🌧️ | Słaby deszcz | Slight rain |
63 | 🌧️ | Umiarkowany deszcz | Moderate rain |
65 | 🌧️ | Silny deszcz | Heavy rain |
66 | 🌧️ | Lekki marznący deszcz | Light freezing rain |
67 | 🌧️ | Silny marznący deszcz | Heavy freezing rain |
71 | 🌨️ | Słaby śnieg | Slight snow fall |
73 | 🌨️ | Umiarkowany śnieg | Moderate snow fall |
75 | ❄️ | Silny śnieg | Heavy snow fall |
77 | ❄️ | Ziarnisty śnieg | Snow grains |
80 | 🌦️ | Słabe przelotne opady | Slight rain showers |
81 | 🌧️ | Umiarkowane przelotne opady | Moderate rain showers |
82 | 🌧️ | Gwałtowne przelotne opady | Violent rain showers |
85 | 🌨️ | Słabe przelotne opady śniegu | Slight snow showers |
86 | ❄️ | Silne przelotne opady śniegu | Heavy snow showers |
95 | ⛈️ | Burza | Thunderstorm |
96 | ⛈️ | Burza z lekkim gradem | Thunderstorm with slight hail |
99 | ⛈️ | Burza z silnym gradem | Thunderstorm with heavy hail |
▶ Demo: popup Scene + pasek + dane
Pełna lista API
Generowana z deklaracji w kodzie (Source/*.pas): wszystkie opublikowane właściwości i zdarzenia TWeather (także dziedziczone), właściwości publiczne i metody publiczne.
Właściwości opublikowane (41)
| Właściwość | Typ | Domyślnie | Opis |
|---|---|---|---|
Active | Boolean | False | |
BaseURL | string | Adres serwera Nominatim | |
ApiKey | string | Klucz API – tylko w kodzie, używany przez {apikey} | |
Key | string | ||
ApiKeyParam | string | ||
RequireApiKey | Boolean | True | |
Parameters | TWeatherParams | ||
Sections | TWeatherSections | [wsCurrent, wsHourly] | |
ForecastKind | TWeatherForecastKind | wfkHourly | |
Area | TWeatherArea | Zaznaczony obszar (kształt, punkty, prostokąt, koło) | |
GridResolutionKm | Double | ||
MaxPoints | Integer | 400 | |
PointsPerAdmin | Integer | 0 | |
ForecastDays | Integer | 3 | |
PastDays | Integer | 0 | |
Timezone | string | ||
TemperatureUnit | TWeatherTemperatureUnit | wtuCelsius | |
WindSpeedUnit | TWeatherWindSpeedUnit | wwuKmh | |
PrecipitationUnit | TWeatherPrecipitationUnit | wpuMm | |
Models | string | ||
AutoRefreshMinutes | Integer | 0 | |
Interval | Integer | ||
CacheTTLSeconds | Integer | WEATHER_DEFAULT_CACHE_TTL_S | |
MinRequestIntervalMs | Integer | Minimalny odstęp między zapytaniami (kolejka); Nominatim: 1000 | |
TimeoutMs | Integer | WEATHER_DEFAULT_TIMEOUT_MS | |
MaxRetries | Integer | WEATHER_DEFAULT_MAX_RETRIES | |
MaxPointsPerRequest | Integer | ||
Areas | TMapAreas | Powiązany komponent TMapAreas (granice, regiony, własne GeoJSON) | |
Map | TComponent | ||
Scene | TComponent | ||
Header | TComponent | ||
HourStrip | TComponent | ||
DayItems | TComponent | ||
Popup | TComponent | ||
AutoLinkComponents | Boolean | True | Automatycznie łącz pierwszy dostawcę wyszukiwania / TMapAreas / TEditMap z formy |
Display | TWeatherDisplay | ||
WidgetStyle | TWeatherWidgetStyle | ||
Charts | TWeatherCharts | ||
UseMapAreaSelection | Boolean | True | |
AutoRequestOnAreaSelect | Boolean | True | |
ShowAreaOnMap | Boolean | True |
Zdarzenia (7)
| Zdarzenie | Typ | Opis |
|---|---|---|
OnDataReady | TWeatherDataReadyEvent | |
OnError | TWeatherErrorEvent | Każdy błąd (ErrorKind, HTTP, komunikat PL/EN) |
OnProgress | TWeatherProgressEvent | |
OnResolveArea | TWeatherResolveAreaEvent | |
OnChartsRequest | TWeatherChartsRequestEvent | |
OnWidgetContent | TWeatherWidgetContentEvent | |
OnAreaApplied | TNotifyEvent |
Właściwości publiczne – tylko w kodzie (7)
| Właściwość | Typ | Opis |
|---|---|---|
Data | TWeatherDataSet | |
SamplePoints | TWeatherLatLonArray | |
PointCount | Integer | |
Busy | Boolean | Trwa zapytanie |
LastErrorKind | TWeatherErrorKind | |
LastError | string | |
LastRefresh | TDateTime |
Metody publiczne (35)
| Metoda | Opis |
|---|---|
function Refresh: Boolean | Ponownie wczytuje hierarchię i pliki |
function Request: Boolean | |
procedure RefreshAsync | |
procedure Cancel | |
function DataJSON: string | |
procedure ClearCache | Usuwa pliki z cache |
function PointLatLon(PointIndex: Integer): TWeatherLatLon | |
function HourlyTimeCount: Integer | |
function HourlyTime(TimeIndex: Integer): string | |
function Value(PointIndex: Integer; P: TWeatherParam; TimeIndex: Integer): Double | |
function CurrentValue(PointIndex: Integer; P: TWeatherParam): Double | |
function MinMax(P: TWeatherParam; TimeIndex: Integer; out AMin, AMax: Double): Boolean | |
function NearestPoint(const Lat, Lon: Double): Integer | |
function ValueAt(const Lat, Lon: Double; P: TWeatherParam; TimeIndex: Integer = -1): Double | |
procedure RegisterLinkedView(View: TComponent) | |
procedure UnregisterLinkedView(View: TComponent) | |
procedure DetectLinkedComponents | Wyszukuje na formie i łączy dostawcę / TMapAreas / TEditMap |
function MapCore: TMapCore | IMapCoreProvider – rdzeń dla TEditMapRaster |
procedure BeginAreaSelect(Shape: TMapAreaShape = masRectangle) | |
procedure CancelAreaSelect | |
procedure ApplyMapArea(const MapArea: TMapArea) | |
procedure ApplyCoords(const Lat, Lon: Double; const RadiusKm: Double = 0) | |
function ApplyCoordsText(const Text: string): Boolean | |
procedure ApplyBounds(const South, West, North, East: Double) | |
procedure UpdateDisplay | |
procedure ClearDisplay | |
procedure CreateWidgetAtCentroid(const AreaName: string = ''; const Admin: string = '') | |
procedure CreateWidgetsForAreas(const GeoJSON: string = '') | |
procedure ClearWidgets | |
function EffectiveDensityMode: TWeatherDensityMode | |
function OverlayGrid: TWeatherOverlayGrid | |
function HourlySeries(PointIndex: Integer; P: TWeatherParam): TArray<Double> | |
function HourlySeriesAt(const Lat, Lon: Double; P: TWeatherParam): TArray<Double> | |
function ChartsJSON(PointIndex: Integer): string | |
function ChartsJSONAt(const Lat, Lon: Double): string |
Pełny opis wszystkich właściwości: dokumentacja komponentów map.
Zobacz też
TWeatherPopup
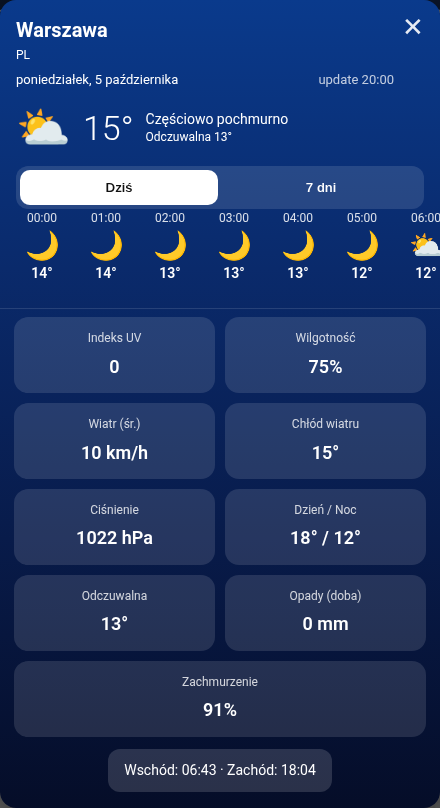
Pełne okno prognozy (skórki iOS glass / Android / custom): nagłówek, pasek godzin, 7 dni i wykresy. Scene za szkłem.
TWeatherScene
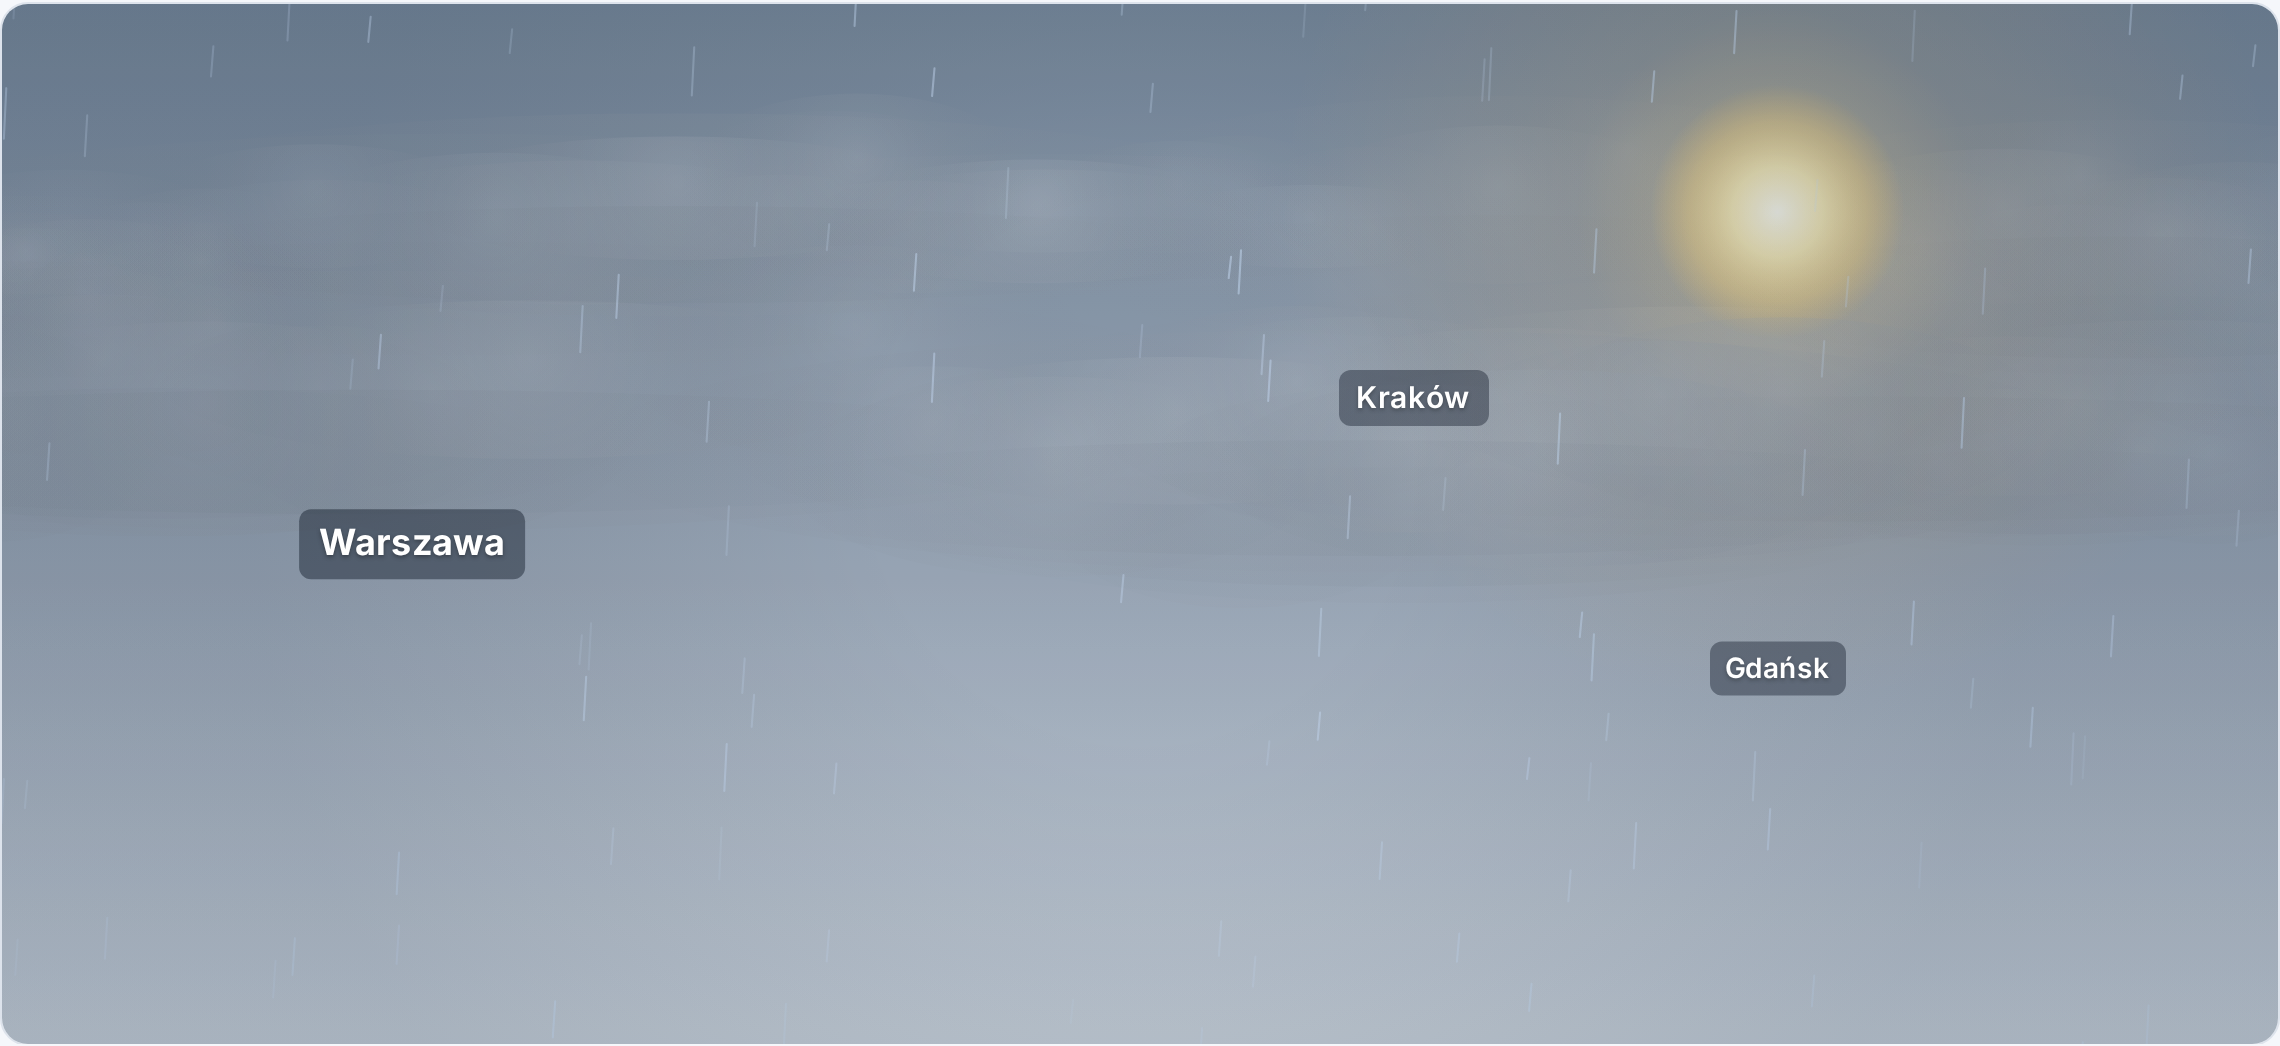
Profesjonalna, realistyczna animacja tła aplikacji pogodowej (nie cartoon): dzień/noc, miękkie chmury, deszcz, słońce, wiatr, gwiazdy. Dane tylko z TWeather — Scene nigdy nie woła serwera.

TWeatherHourStrip
Pasek godzinowy prognozy (ikony WMO + temperatura). Wypełnia okno po danych z TWeather.
TWeatherDayItems
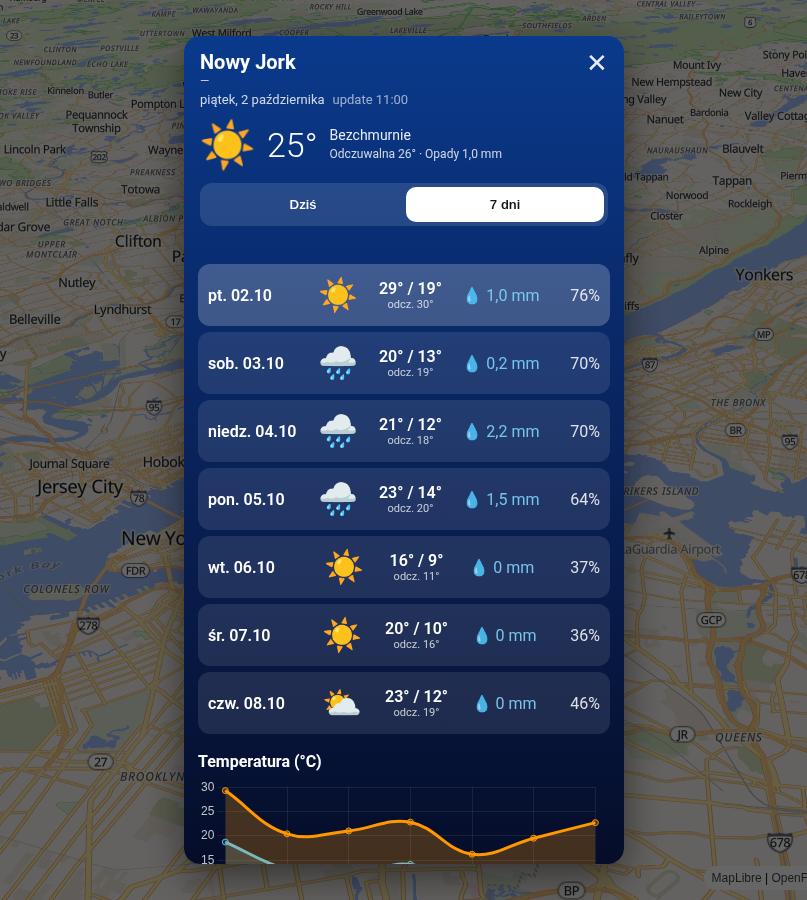
Prognoza 7 dni w kafelkach (ikona, min/max, opady). Część okna TWeatherPopup.
TWeatherChart
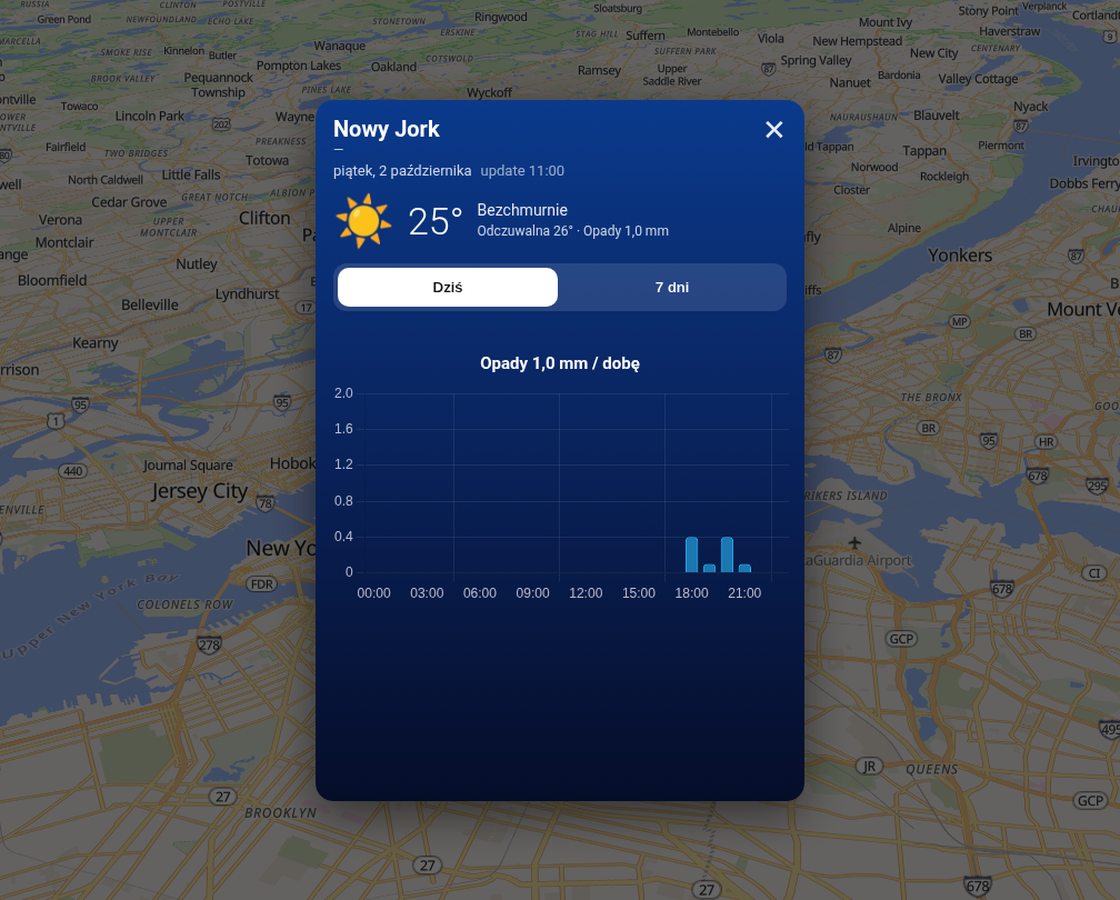
Wykresy pogodowe (temperatura, wilgotność, wiatr…). Serie z legendą w oknie prognozy.
TTileMapVCL
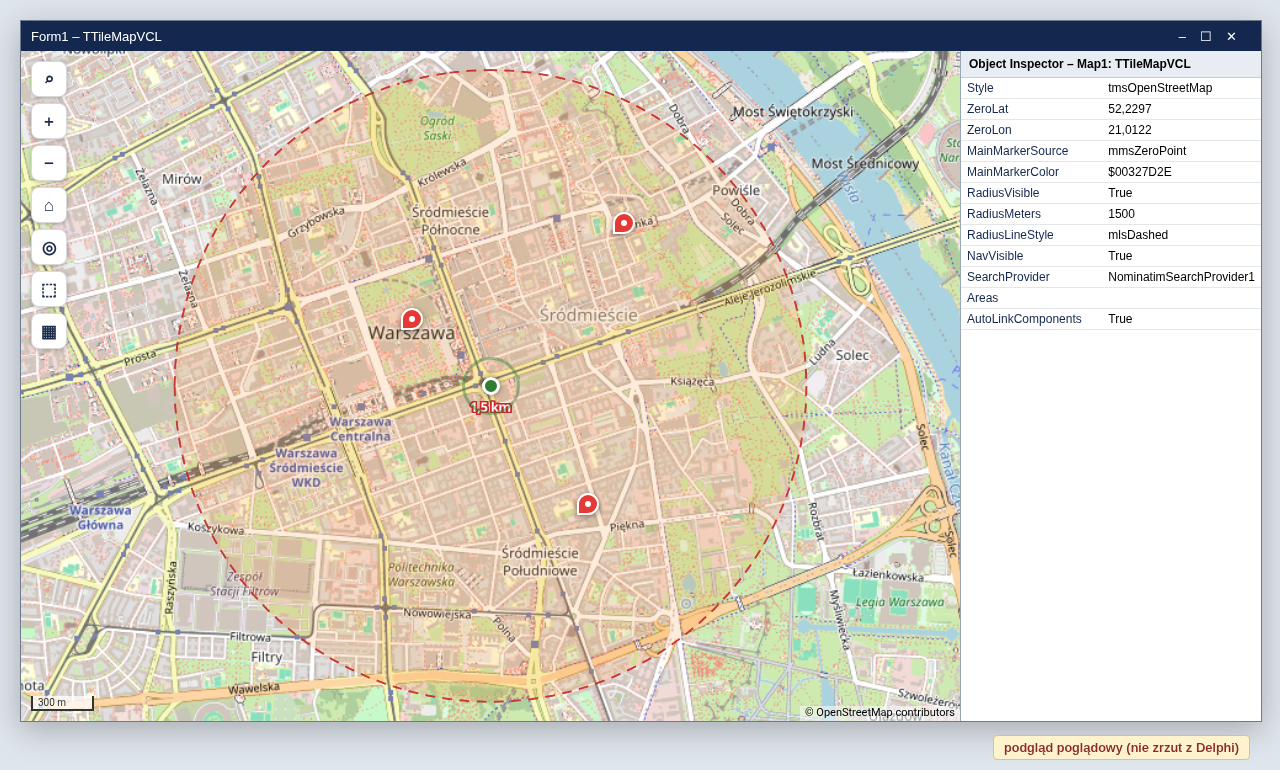
Mapa kafelkowa dla aplikacji Windows (VCL) – OpenStreetMap, zdjęcia satelitarne, mapa terenu.
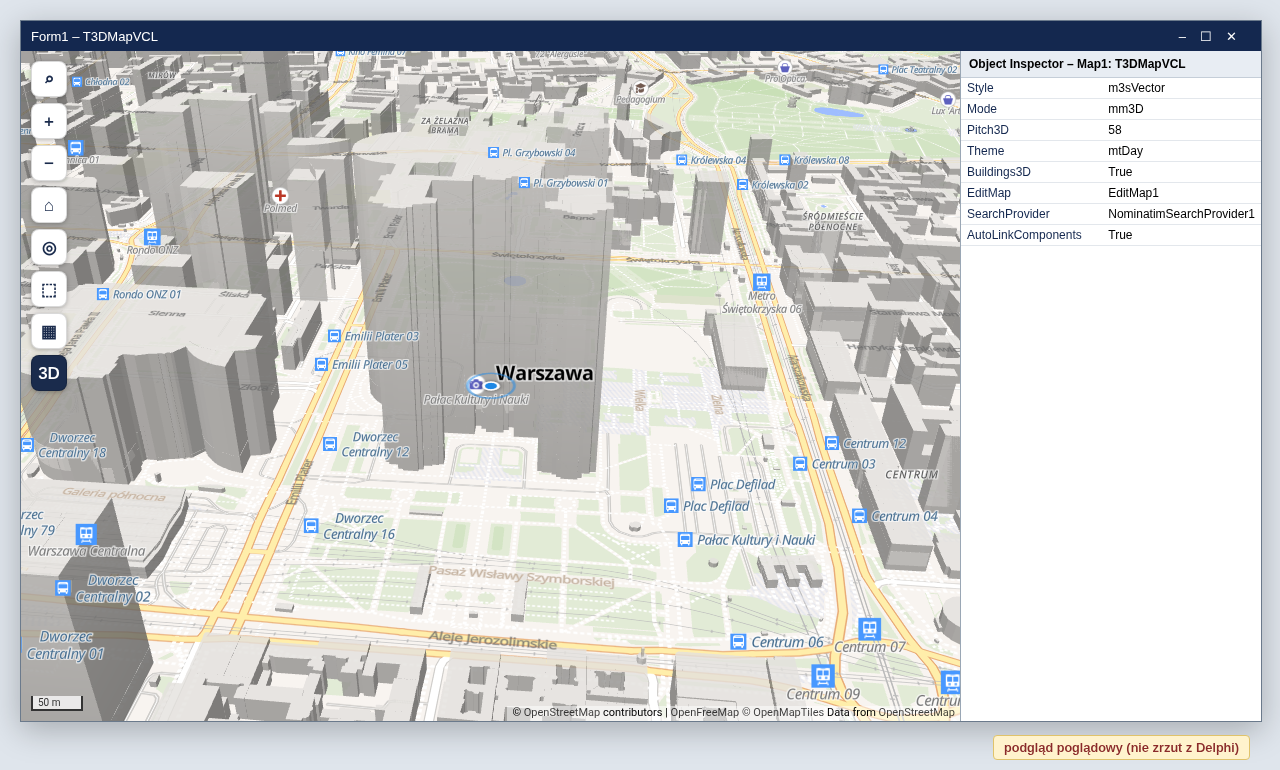
T3DMapVCL
Mapa wektorowa 2D/3D z budynkami, motywem dziennym/nocnym i własnymi kaflami z mapa.imetroll.com.