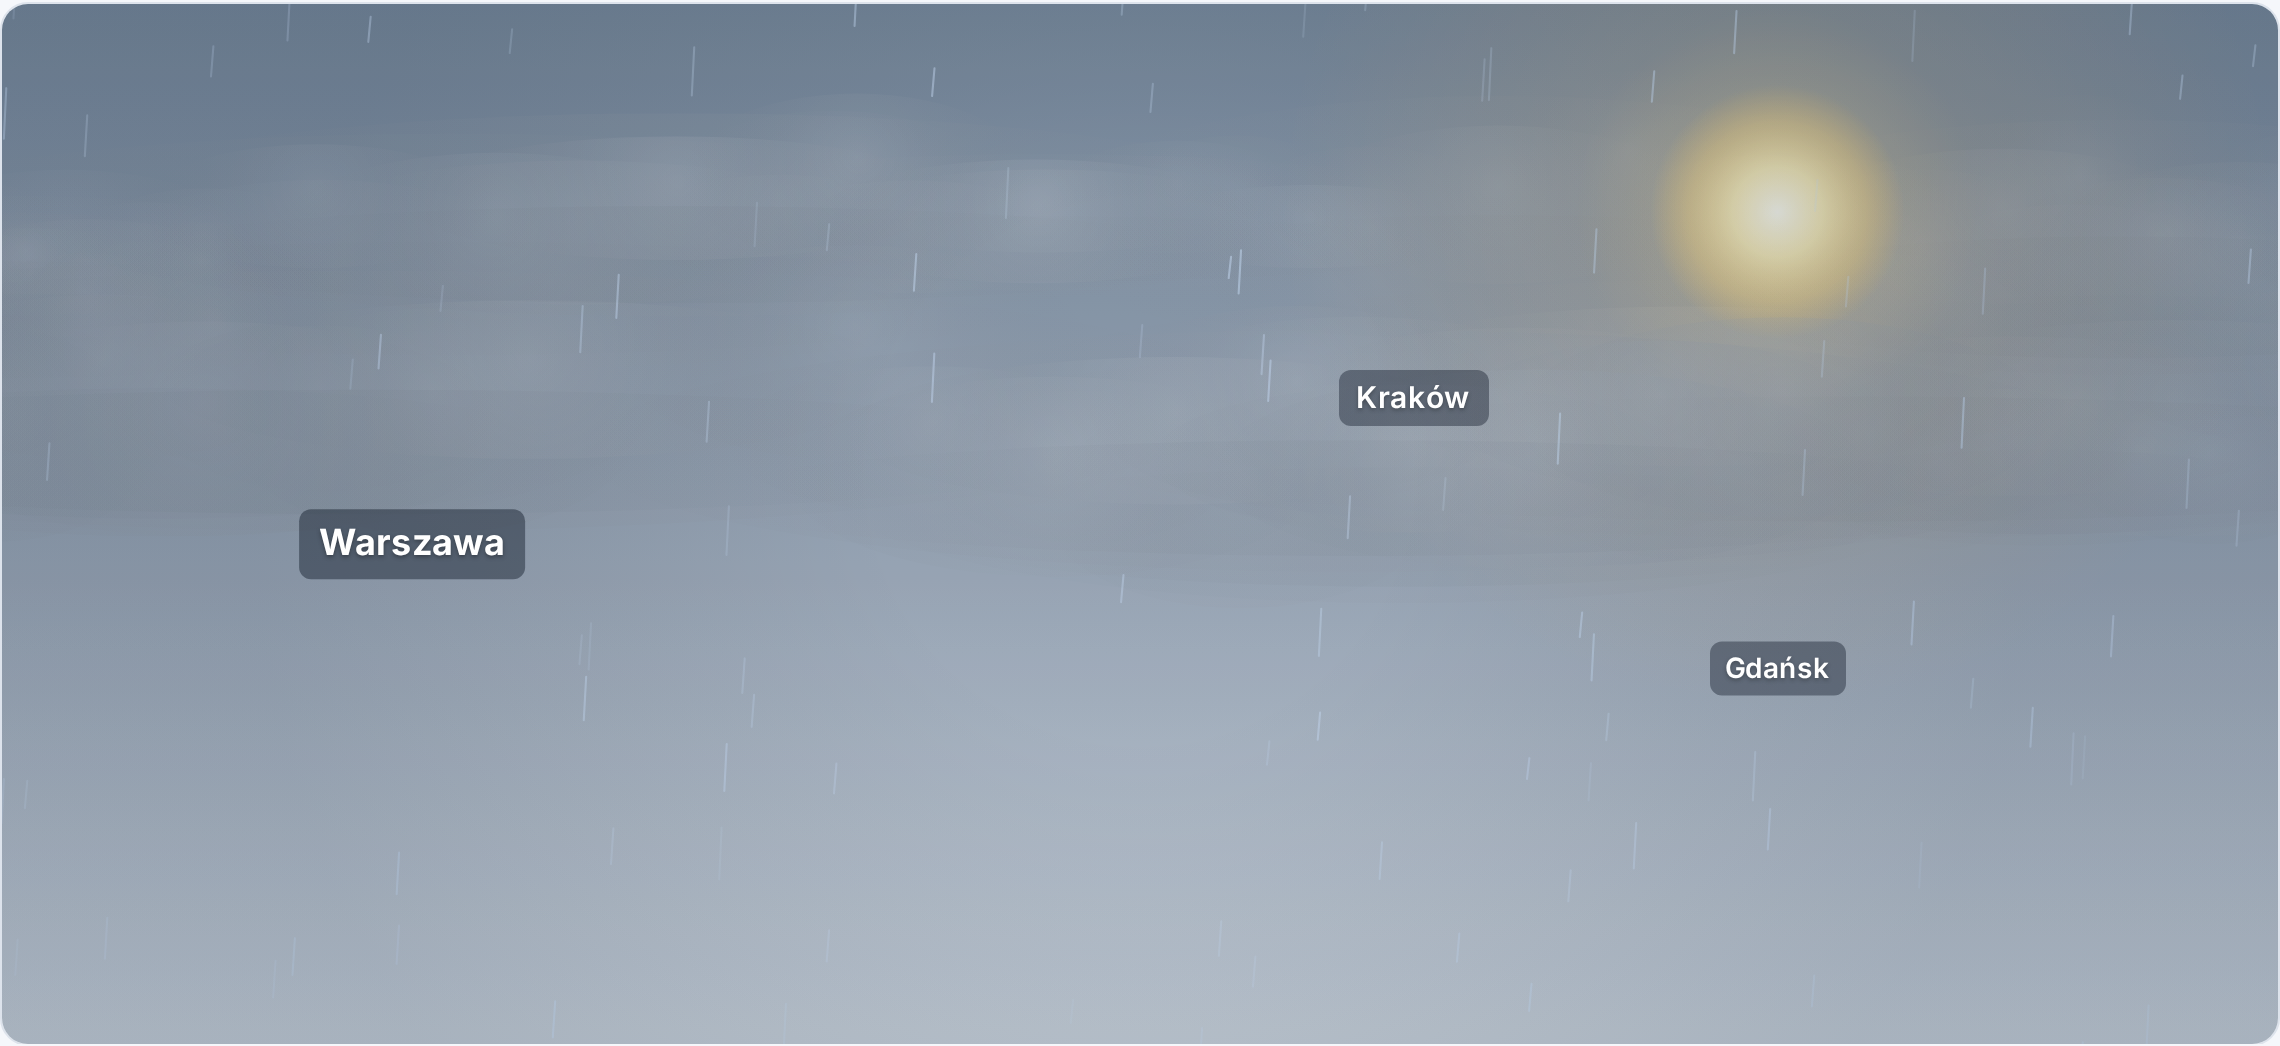
Opis
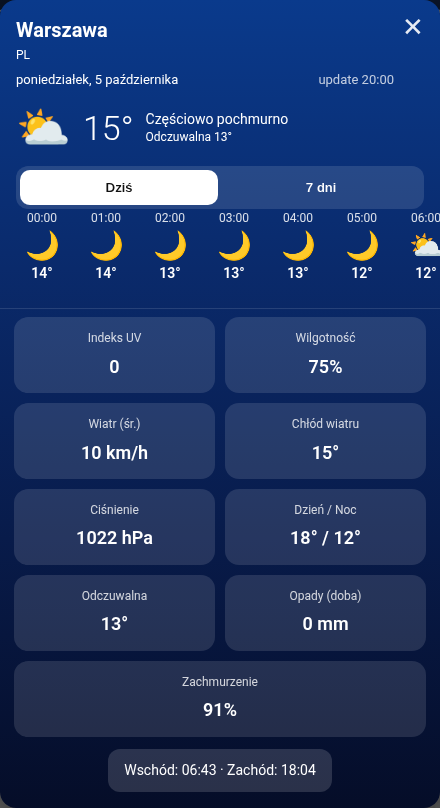
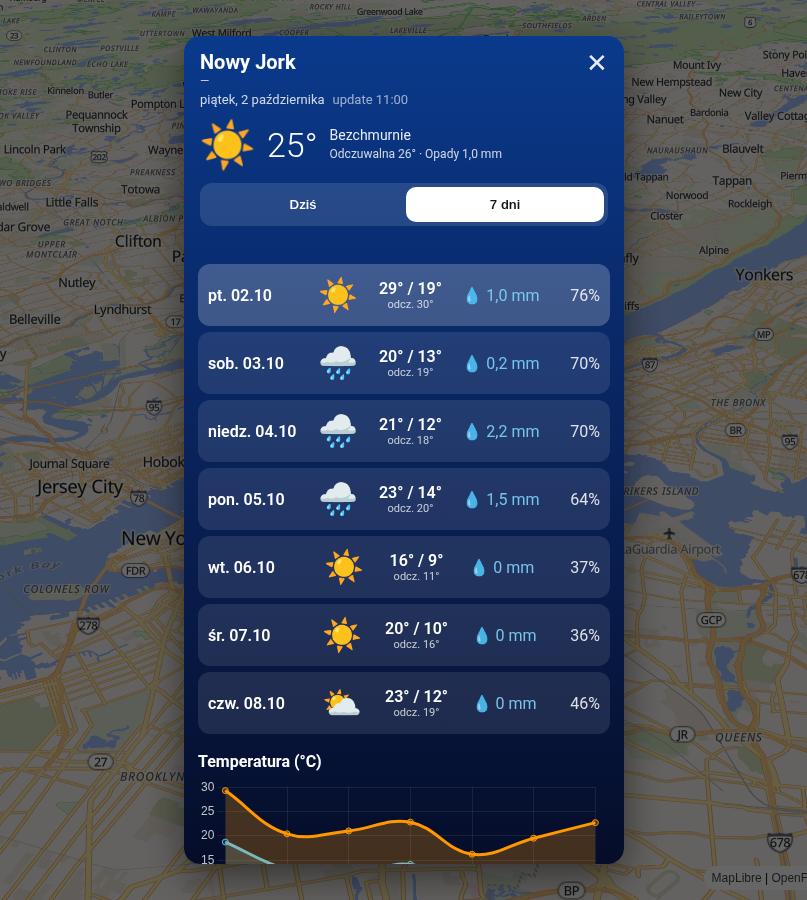
Komponent niewidoczny. Z bloku daily buduje kafelki (ikona, tmax/tmin, opady). Wymaga TWeather — sam DayItems nie otwiera okna. Razem z HourStrip/Chart wypełnia zakładkę „7 dni”.
Moduł: MapCommon.Weather.Views · Klasa bazowa: TWeatherLinkedView · Platformy: VCL + FMX
Demo na żywo
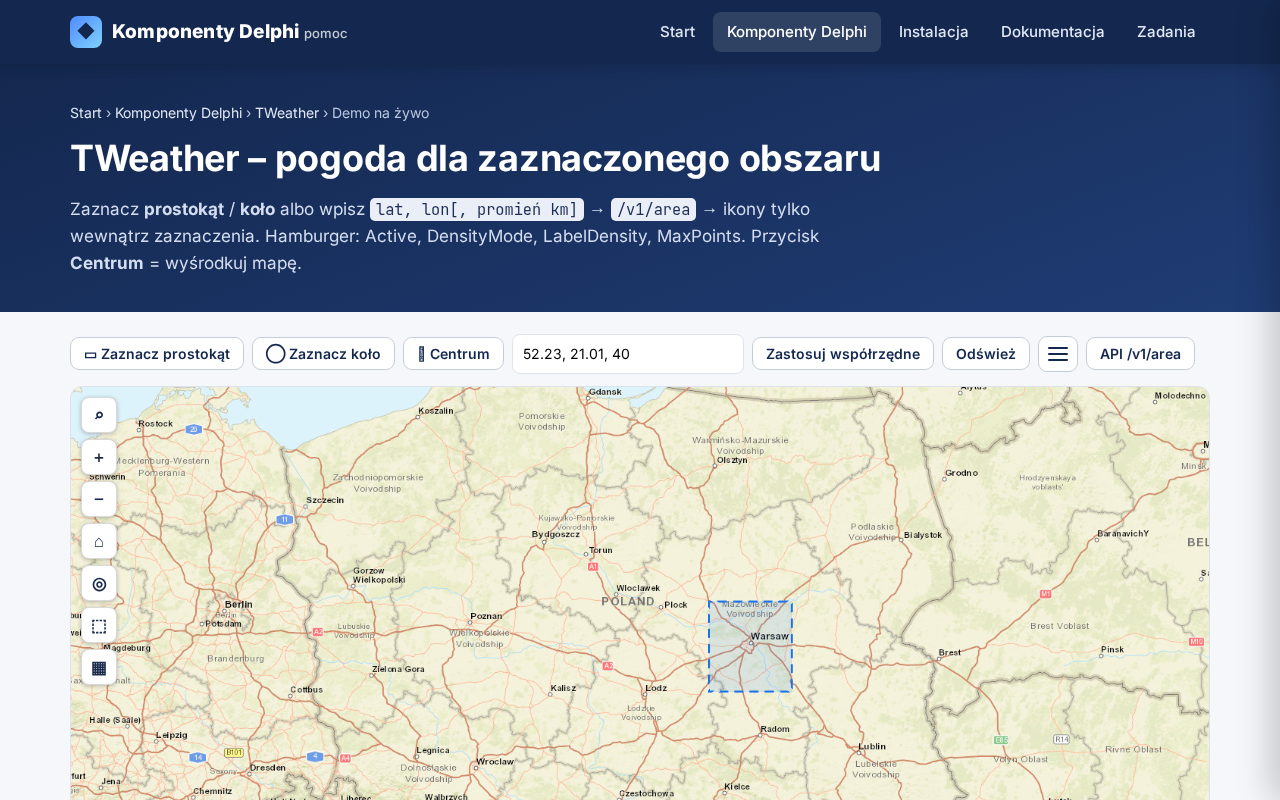
Interaktywne demo HTML.
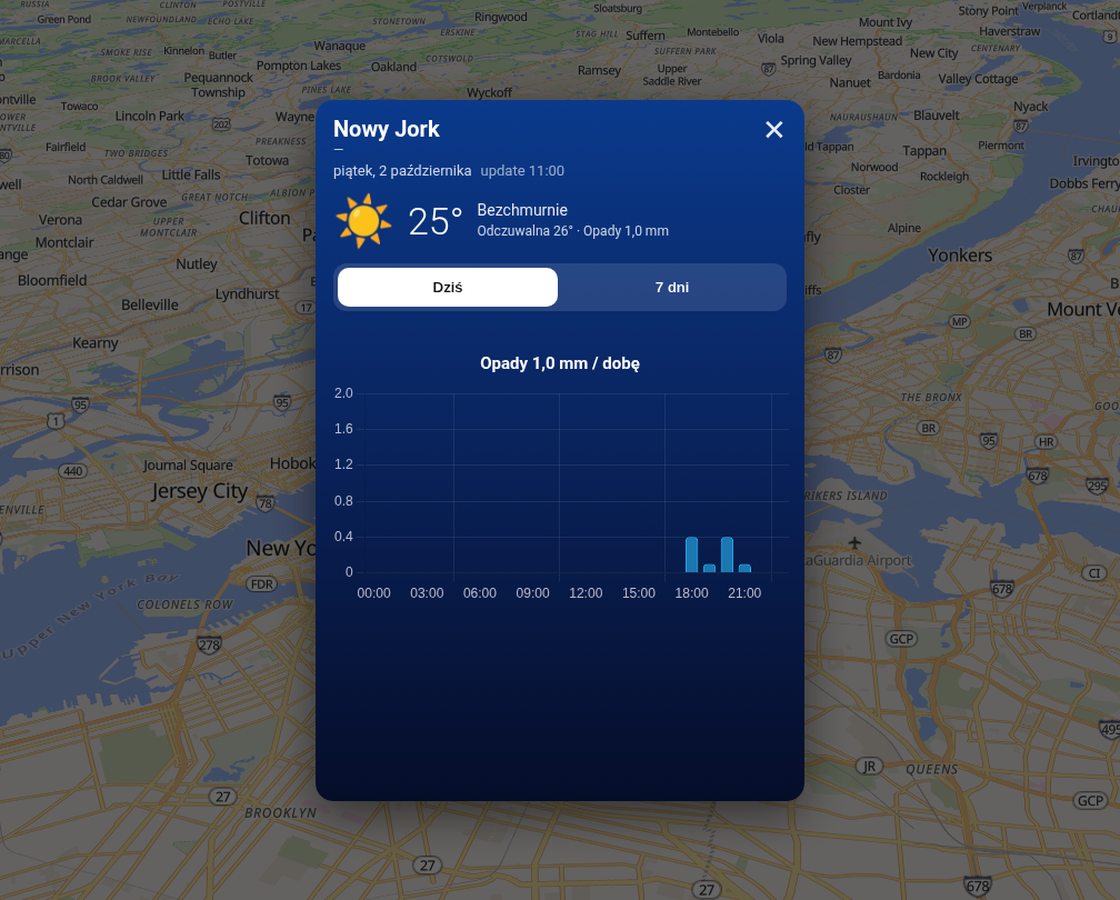
TWeather + DayItems (+ HourStrip/Chart) — zakładka 7 dni w oknie prognozy.
▶ Klik obszaru → modal 7 dniTen sam modal z Display na mapie.
▶ TWeather + ChartsFunkcje
- MaxDays, ShowPrecip / ShowRange / ShowDesc.
- Style + UseCustomIcons.
- AutoLink RegisterLinkedView.
Właściwości
| Właściwość | Opis |
|---|---|
| Weather, Host, Style, UseCustomIcons | Jak HourStrip. |
| MaxDays, ShowPrecip, ShowRange, ShowDesc | Zawartość kafelków. |
Zdarzenia
| Zdarzenie | Opis |
|---|---|
| OnViewChanged | Po przebudowaniu. |
Metody
| Metoda | Opis |
|---|---|
| ApplyJSON / ViewJSON / RefreshHost |
Przykłady
Weather + DayItems
// Klik obszaru → okno z Scene + dane + HourStrip / Chart
procedure TForm1.Areas1AreaClick(Sender: TObject; const Lat, Lon: Double;
  const AreaName, Admin: string);
begin
  Weather1.Area.Kind := wakPoints;
  Weather1.Area.Points.Text := Format('%.4f,%.4f', [Lat, Lon], WeatherInvariantFS);
  Weather1.ForecastKind := wfkHourly;
  FPopupAreaName := AreaName;
  Weather1.Request; // middleware — UI family dostaje OnDataReady przez RegisterLinkedView
end;

procedure TForm1.FormCreate(Sender: TObject);
begin
  Weather1.ApiKey := GetEnvironmentVariable('WEATHER_API_KEY');
  WeatherScene1.Weather := Weather1;     // AutoLink też OK
  WeatherScene1.Labels.Caption := 'Warszawa 25°C';
  WeatherScene1.Host := PanelSky;

  HourStrip1.Weather := Weather1;
  HourStrip1.Style.Caption := 'Godziny';
  HourStrip1.Style.FontSize := 12;
  HourStrip1.UseCustomIcons := False;    // True + CustomIcons = własne PNG

  DayItems1.Weather := Weather1;
  DayItems1.MaxDays := 7;

  // Wiele serii na jednej osi + legenda / ticki / format
  Chart1.Weather := Weather1;
  Chart1.ShowLegend := True;
  Chart1.ShowXTicks := True;
  Chart1.ShowYTicks := True;
  Chart1.XAxisCaption := 'Czas';
  Chart1.YAxisCaption := '°C / %';
  Chart1.YValueFormat := '0.0';
  Chart1.Series.Clear;
  with Chart1.Series.Add do begin
    Title := 'Temperatura'; Parameter := wpTemperature2m;
    Color := '#ff9800'; ChartKind := wckLine;
    ShowPoints := True; PointStyle := wpsFilled; PointOpacity := 0.9;
  end;
  with Chart1.Series.Add do begin
    Title := 'Wilgotność'; Parameter := wpRelativeHumidity2m;
    Color := '#4fc3f7'; ChartKind := wckLine;
    ShowPoints := True; PointStyle := wpsHollow; PointColor := '#0288d1';
  end;
end;
Pełna lista API
Generowana z deklaracji w kodzie (Source/*.pas): wszystkie opublikowane właściwości i zdarzenia TWeatherDayItems (także dziedziczone), właściwości publiczne i metody publiczne.
Właściwości opublikowane (11)
| Właściwość | Typ | Domyślnie | Opis |
|---|---|---|---|
Weather | TWeather | ||
Host | TComponent | ||
AutoLinkComponents | Boolean | True | Automatycznie łącz pierwszy dostawcę wyszukiwania / TMapAreas / TEditMap z formy |
Active | Boolean | True | |
UseCustomIcons | Boolean | False | |
CustomIcons | TStrings | ||
Style | TWeatherViewStyle | Styl mapy (enum): kafle OSM / satelita / teren / własne (TTileMap*) lub styl wektorowy (T3DMap*) | |
MaxDays | Integer | 7 | |
ShowPrecip | Boolean | True | |
ShowRange | Boolean | True | |
ShowDesc | Boolean | True |
Zdarzenia (1)
| Zdarzenie | Typ | Opis |
|---|---|---|
OnViewChanged | TWeatherViewEvent |
Właściwości publiczne – tylko w kodzie (1)
| Właściwość | Typ | Opis |
|---|---|---|
LastViewJSON | string |
Metody publiczne (6)
| Metoda | Opis |
|---|---|
procedure ApplyJSON(const JSON: string) | |
procedure ApplyFromWeather | |
procedure Clear | Usuwa własne pliki |
procedure RefreshHost | |
function ViewJSON: string | |
procedure DetectLinkedComponents | Wyszukuje na formie i łączy dostawcę / TMapAreas / TEditMap |
Pełny opis wszystkich właściwości: dokumentacja komponentów map.
Zobacz też
TWeather
Pogoda na mapie: ikony i temperatura na obszarach (skórki iOS glass / Android / custom); JSON z weather.imetroll.com (current / godzinowo / 7 dni).

TWeatherHourStrip
Pasek godzinowy prognozy (ikony WMO + temperatura). Wypełnia okno po danych z TWeather.
TWeatherChart
Wykresy pogodowe (temperatura, wilgotność, wiatr…). Serie z legendą w oknie prognozy.